Monitor performance in ARM Cortex-A from your code
To optimize system performance, it is important to have tools to monitor the application performance.
High-end ARM processors based on Cortex-A and Cortex-R include Performance Monitor Unit (PMU) which provides useful information about performance, for example event count and cycle count. PMU is located in CP (Co-processor) 15 register. To access the Co-processors from the code, special instructions MCR (Move from Register to Co-processor) and MRC (Move from Co-processor to Register) are used.
IAR Embedded Workbench for ARM offers intrinsic functions to issue those instructions from source code. Using these functions together makes it possible to see the current status and determine how to brush-up the performance. Let’s take a look at how to use these intrinsic functions and PMU of Cortex-A5 from the code.
Source code to control and get Cycle counter in PMU
To use intrinsic functions to access to Co-Processor, intrinsics.h needs to be included.
#include <stdint.h> //needed for using uint32_t
#include <intrinsics.h>

#define PMCNTENSET_CYCLECOUNTER_ENABLE 31
#define PMCR_CYCLECOUNTER_DIVIDER 3
#define PMCR_CYCLECOUNTER_RESET 2
#define PMCR_CYLECOUNTER_ENABLE 0

__arm uint32_t init_cyclecounter(){
    uint32_t value;
    //enable cyclecouner function
    value =(unsigned long)( 1 << PMCNTENSET_CYCLECOUNTER_ENABLE);
    __MCR(15,0,value,9,12,1);
    //configure the cyclecounter module
    value = __MRC(15,0,9,12,0);
    value |= ((1 << PMCR_CYCLECOUNTER_DIVIDER) |
            (1 << PMCR_CYCLECOUNTER_RESET) |
            (1 << PMCR_CYLECOUNTER_ENABLE));
    __MCR(15,0,value,9,12,0);
    //read current cyclecounter vlaue
    value = __MRC(15,0,9,13,0);
    return value;
}

__arm uint32_t get_cyclecounter()
{
//read the current cyclecounter value
    uint32_t value;
    value = __MRC(15,0,9,13,0);
    return value;
}
Simple example for testing the functions
Here is a simple example on how to use those two functions:
#define NUMBER 64
uint32_t a[NUMBER],b[NUMBER],c[NUMBER];
void function_to_be_measured()
{
  for(uint32_t i = 0;i<NUMBER;i++)
  {
    c[i] = a[i]*b[i] + a[i]+b[i];
  }
  return ;
}

#include <stdio.h>
int main()
{
  uint32_t count1, count2 = 0;
  init_cyclecounter();
  count1 = get_cyclecounter();
  function_to_be_measured();
  count2 = get_cyclecounter();
  printf("time elapsed:%u\n",(count2-count1));

  return 1;
}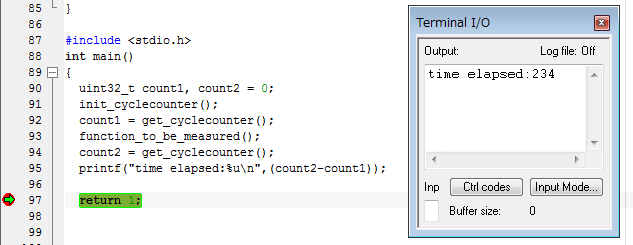
The result is displayed in cycle count based number. Here are some results with various compiler optimization levels for this particular code:
| Low | 414 |
| High: Speed | 234 |
| High: Speed with vectorization | 117 |
In this example, PMCR_CYCLECOUNTER_DIVIDER is set to update count every 64 cycles. You could clear PMCR_CYCLECOUNTER_DIVIDER to see the cycle counts. If you know the CPU clock cycle, the actual time elapsed can be calculated easily.